Historic England - High Street Heritage Action Zones
How can you use data to identify ‘similar’ locations? For retailers, looking for areas similar to those with high performing stores, this may be a simple enough task. Counts of surrounding population, competition and demographic data lend themselves well to similarity modelling.

What if we cast this net further, what if the objective is to gauge similarity in dimensions beyond just supply and demand? Recently we have had the pleasure of working with Historic England to solve this problem; using a data driven approach to help measure how similar two areas are.
Historic England’s aim is to monitor the progress and impacts of their High Street Heritage Action Zones scheme (HSHAZ) against a baseline of other similar non-HSHAZ locations.
By using a data-driven approach, we hoped to remove, or at least reduce any bias and subjectivity which are inevitable when comparing locations that we know well. Data was collected from a variety of sources, and covers five key categories:
- Demographic and socio-economic status
- Commercial environment
- Workplace statistics
- Infrastructure/points of interest
- Historic environment
Quantifying some of these datasets required a little extra thought. For Historic Environment, an approximation of listed buildings per address was used as a key input. Size was attributed using our urbanity dataset (to ensure Manchester would not match with Manningtree). A town’s catchment was calculated using our Retail Place gravity model. To understand how the destination is used, a commercial to residential property ratio was calculated…
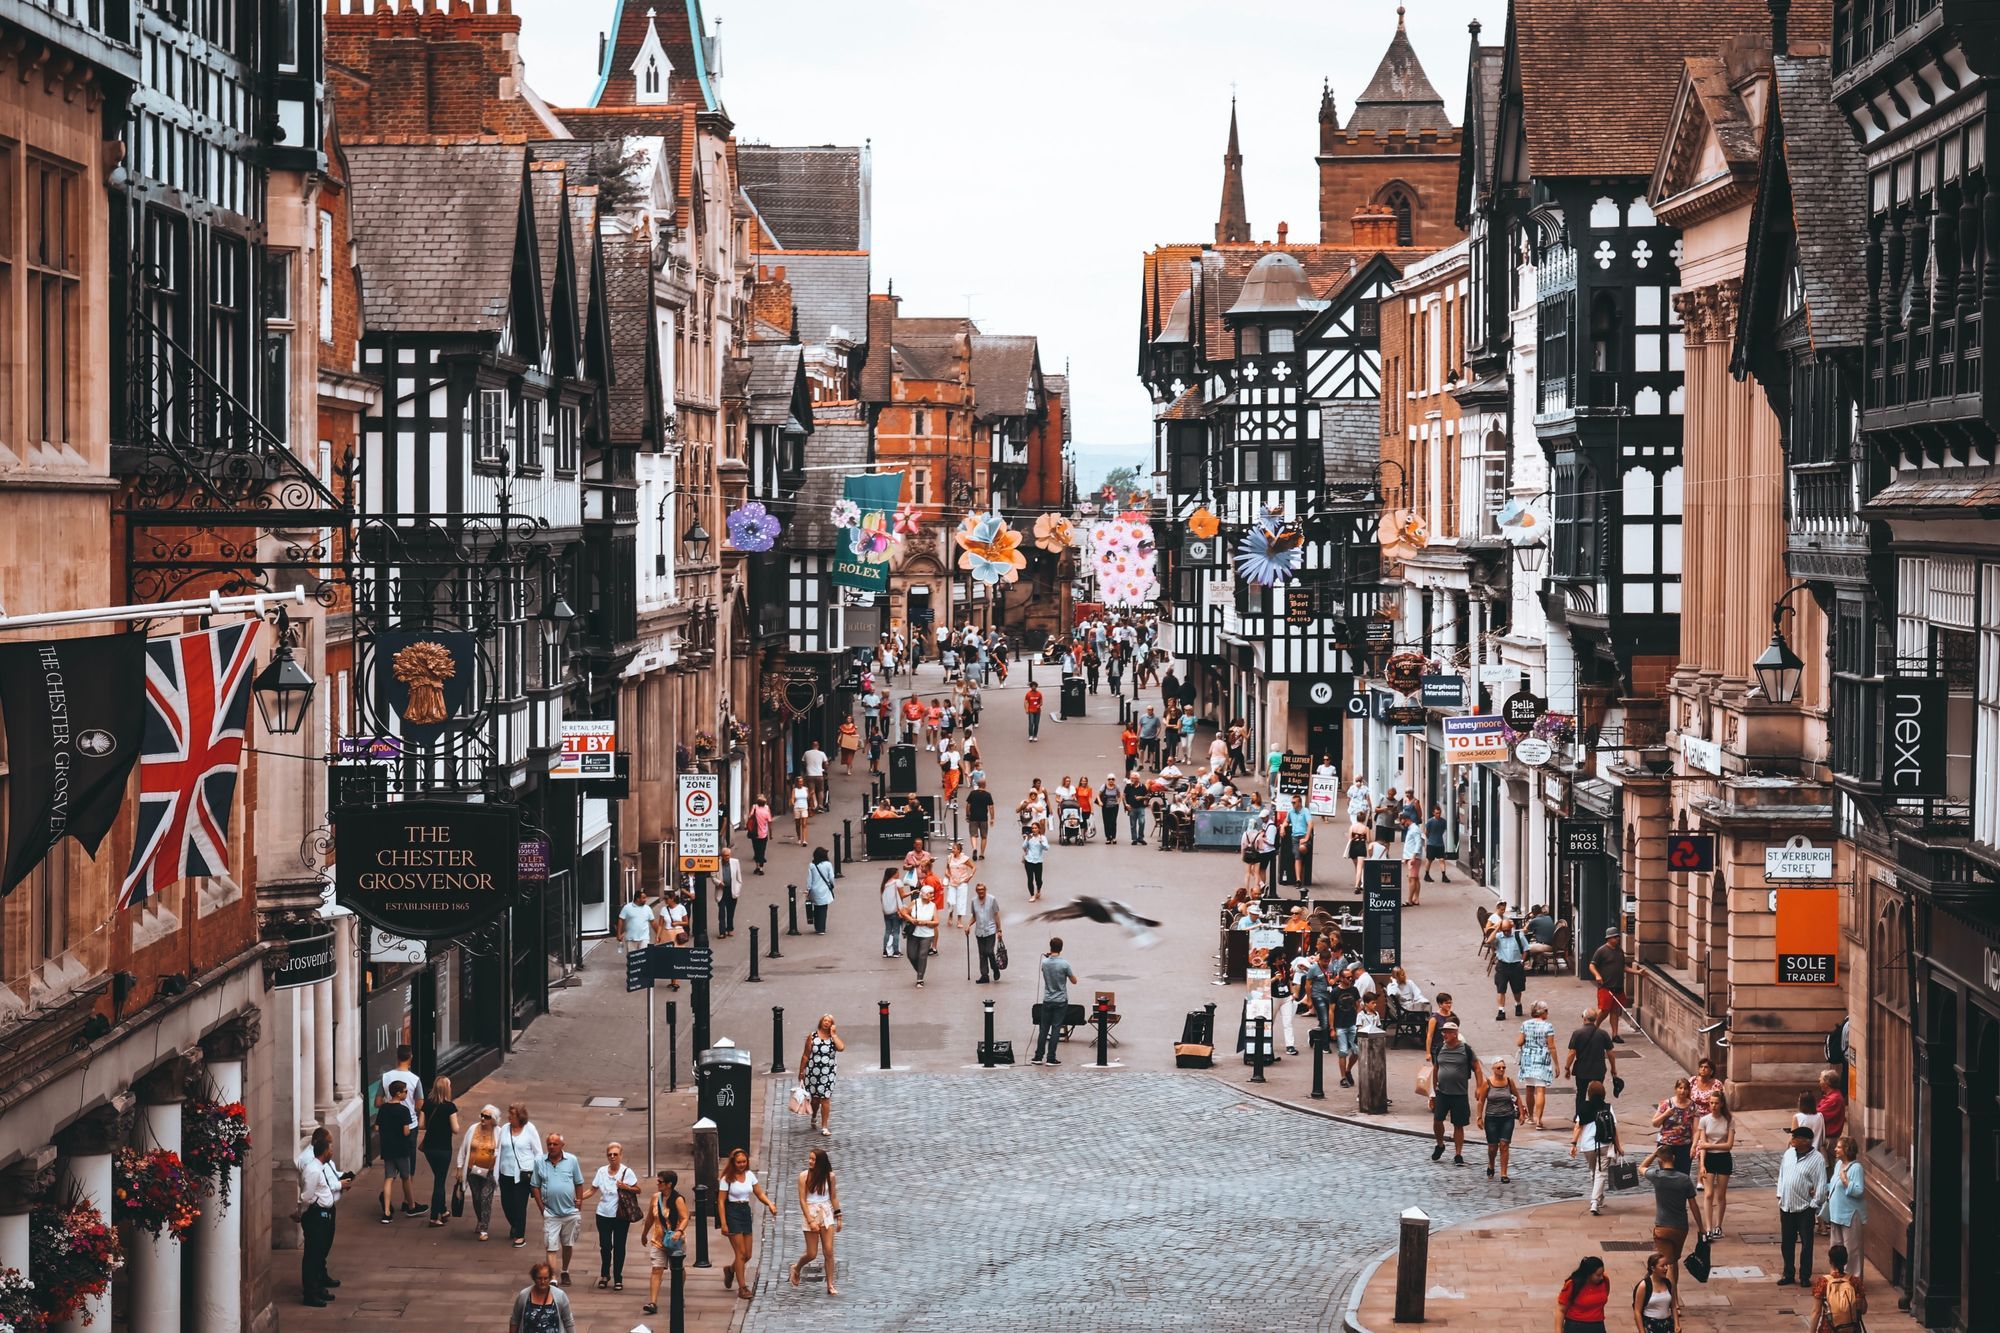
An example of why these very different data sources were all important can be seen here: If we were to compare Chester with other towns using the Indices of Multiple Deprivation, and # of households within a 10 minute drivetime (the types of datasets we’re very familiar working with in location planning), we’d see that it is almost statistically identical, to Norwich. Not the worst match, but this probably is not the first town which springs to most people’s mind when asked to name somewhere which reminds them of Chester.
However, when we factor in other information on the makeup of the town itself, our most similar matches include Worcester, Colchester, Oxford, Cambridge and York. Much better! Which factors contributed to these matches (it wasn’t number of cobbles and ye olde sweetshops)? Catchment urbanities, strength of retail offerings, proportion of listed buildings and worker densities are all very similar across the towns.
This does not mean however that we should abandon our traditional location planning datasets though. A town’s recent industrial past may be hard to quantify directly, but demographic datasets can still help us to create sensible matches. Former mining towns such as Barnsley, match with other northern post-industrial towns (e.g. Burnley and Blackburn as top matches in this case); sensible matches which are largely driven by the towns’ catchment demographics and size.
The learning here is that whilst many of these data values alone don’t tell us a whole lot about the personality or identity of a place, when combined and used as a means of identifying statistically similar locations, the data is brought to life. It is may be easy for those who have visited Chester and York to understand their similarities. By combining a variety of very different datasets we have shown that it’s possible to identify such similar locations using a data driven approach.
We are looking forward to seeing how the HSHAZ programme continues to evolve over the next few years and the benefits it will bring to our much-loved high streets. If you’d like to learn more about the High Street Heritage Action Zones programme, you can read more here.
Danny Hart, Data Scientist at GEOLYTIX
Photo by Rachel Hannah Photo on Unsplash