International Busyness Index: Identify Activity Hot Spots across the world
Geolytix Busyness Index can be calculated worldwide and makes it easy to spot busyness trends.


We are excited to be able to offer another mobility data based product. This blog focuses on International Busyness Index – identifying activity hot spots in markets across the world. Check out our other blogs on Small Area Footfall (a contiguous hex grid showing footfall estimates at micro level within Retail Places), and Tracker (reporting visitor numbers in Retail Places over time).
Our International Busyness Index uses our market leading experience with mobility data to provide a country level busyness ranking with the potential to cover 50+ countries.
The index reflects pedestrians and vehicles passing through a location, it is calculated separately for each individual country, based on one years’ worth of data. The index is reported at 200m hexes covering the entirety of a country and the ranking can be viewed across different time periods:
- Average across 12 months period
- Weekends
- Weekdays
- Day Part (h: 0-6,6-12,12-18,18-24)
Busyness in Action
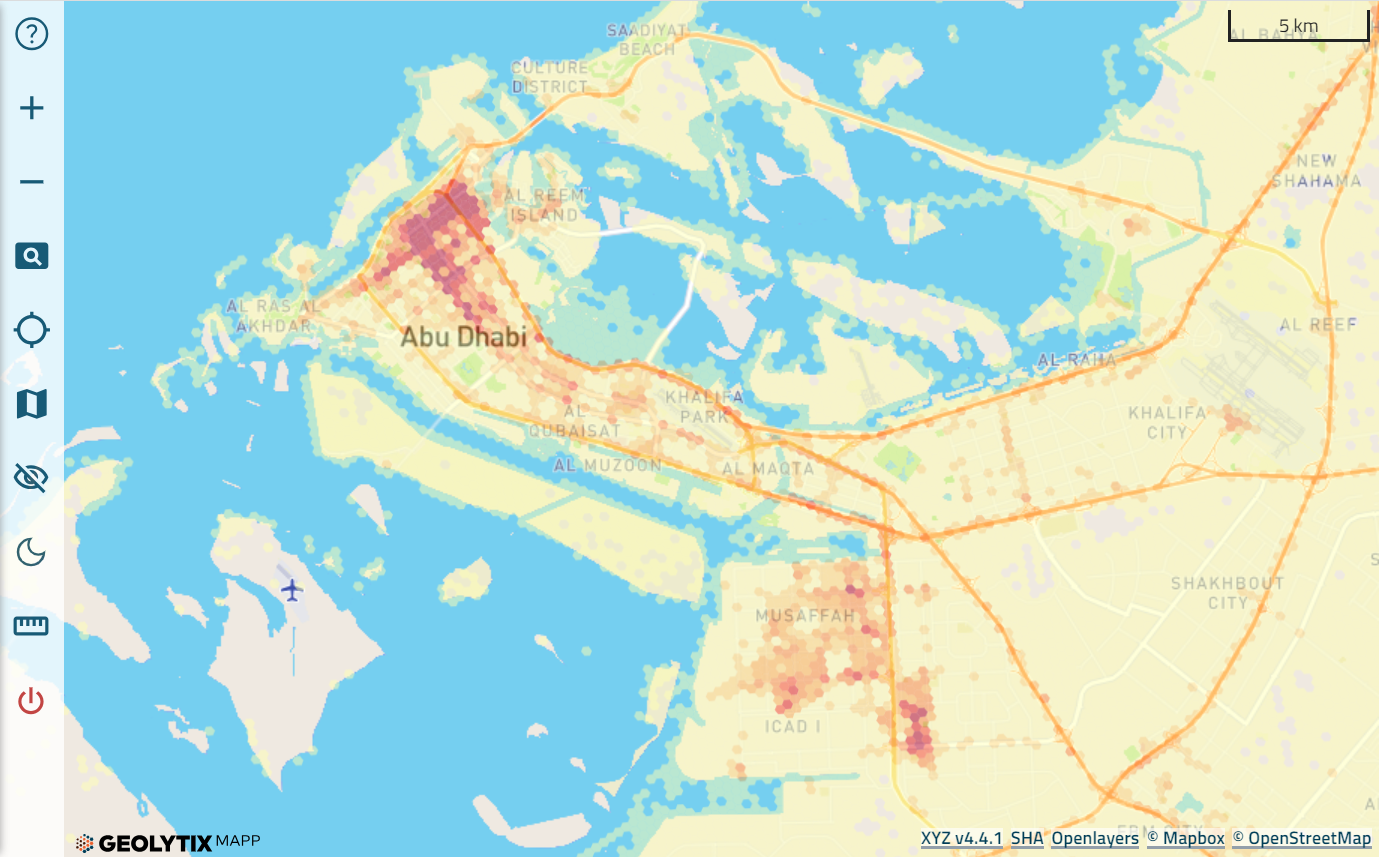
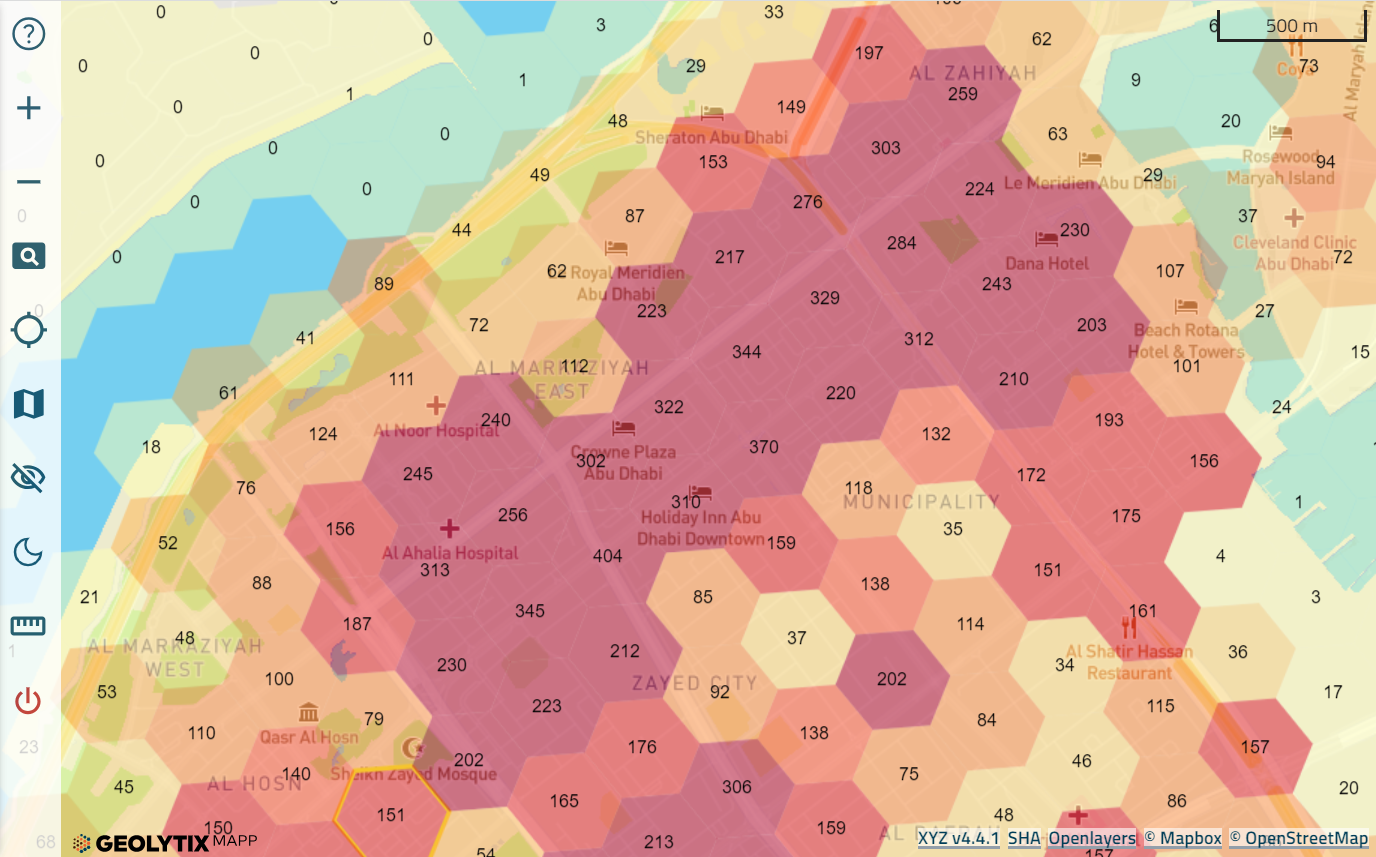
In the images below we focus on the daily International Busyness Index in Abu Dhabi. We can clearly see the busyness trends in the city: the busiest area is unsurprisingly central where there are the most iconic and tourist places and buildings. It is also possible to spot the importance of Musaffah industrial district, one of the most important economic areas in the United Arab Emirates.
Together with this, the International Busyness Index product also includes a 24hr focus on activity levels within urban sprawls. Every individual sprawl has its own busyness index which is calculated for each hour and visualised at a 75m hex, which can be represented as a rolling animation within our MAPP platform.
International Busyness Index is easily accessible in GEOLYTIX MAPP and can be integrated with your data in an existing or a new MAPP instance, or used standalone.
Why we love using Geolytix International Busyness Index
It can be calculated worldwide, so allows us to apply a consistent approach across multiple countries. Within each country, the Index is proportional, so a location with a score of 200 is twice as busy as that with the (country retail place average) score of 100. This can help to support macro site selection and network planning, as the busiest locations can be identified at a glance.
It also helps to remove the guesswork from micro site selection within urban areas, as the 24 hour sprawl index makes it easy to spot different busyness trends for different day types and day parts - allowing us to identify the ideal location for a late night quick service restaurant, vs. a grocery store where we expect more consistent busyness trends throughout the day.
Finally we can easily highlight busyness peaks and troughs within each urban area and supports in understanding whether the distribution of traffic suits your site needs.
To learn more about how mobility data works check out our earlier blog – Mobility data: Behind the Scenes.
We’d be delighted to give you a demo of our mobility products and talk to you about any specific needs you might have, please get in touch at info@geolytix.com.
Alessandro De Martino, Spatial Data Engineer at GEOLYTIX