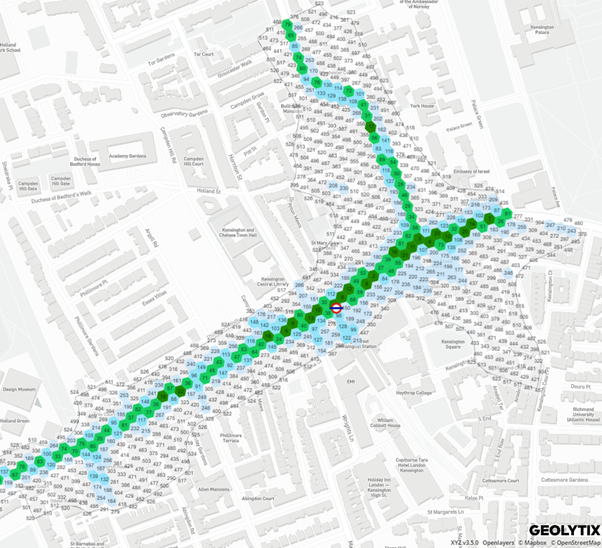
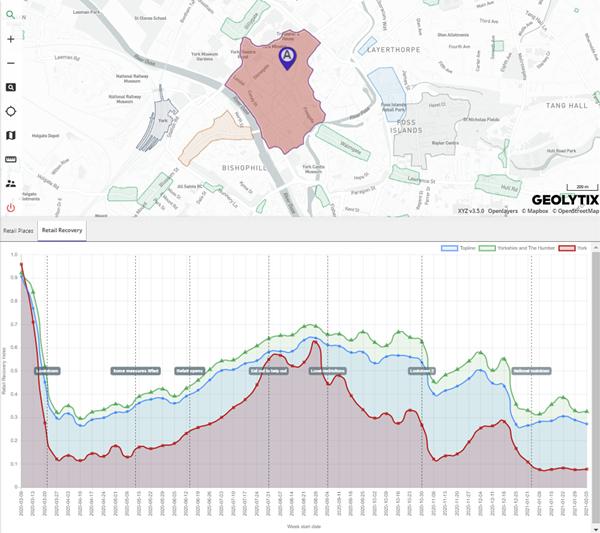
Weekly Retail Recovery feeds and activity hotspot maps in MAPP
Mobile ping data is now integrated into MAPP allowing you to use real-life mobile activity data to inform your location decisions. Combining this with our Retail Recovery Index you can track retail recovery trends comparing against both regional and national averages.

“Can you provide an accurate understanding of people’s movements across towns & cities by time of day and day of the week so I can decide where to open my shop?” is something I’m often asked.
Without physically going out to a high street and observing shoppers, it is difficult to gauge what are the ‘busiest’ areas of a town (especially now with restrictions on travel).
Cameras counting pedestrians passing provide the best read of footfall for that particular point, but unfortunately these are at a scattering of locations. Manually counting footfall has also given many much-needed insight, but only provides a snapshot of time, and is time-consuming and costly for a large number of locations.
When a comprehensive, up-to-date picture of the entire retail landscape is required, additional data needs to be harnessed.
For almost two years, GEOLYTIX have been using mobility ping data to understand activity levels across multiple markets across the world. In the UK, we’ve processed over 16 billion pings of high quality, highly granular location data from the last two years to provide us with an understanding of retail activity levels & patterns pre & during the pandemic. Through linking the data to >8,000 of our retail place boundaries, we have primarily been using the data in two ways:
- For tracking retail recovery rates by retail place since the UK went into lockdown in March 2020
- For identifying ‘hotspots’ of activity within retail places by time of day, during a ‘normal’ year

We’ve seen enormous value in this data as not only is it as close to ‘real time’ movement as possible (we receive a weekly updated feed), but it can also be used for micro-analyses of high streets. As an example, some of our clients have been using it to understand when activity levels outside their stores are high enough to warrant re-opening, following the easing of restrictions during the pandemic.
It sounds like great data, how can I access it?
All of the data has been processed and integrated into our online platform MAPP, giving you the power of real-life mobile activity data at your fingertips.
For the UK, we have assigned and calculated a Retail Recovery Index (which compares current activity levels with the same time the year before, taking into account seasonal adjustments) for over 8,000 retail places, which gets updated weekly allowing users to track current recovery trends in relation to both regional and national averages. We can also customise bespoke counts around an estate or any set of locations.

Using the 2019 data to represent a ‘normal’ year – equating to over 8.7 billion pings – we’ve also created a mobility activity ‘hotspot’ grid for each of the 8000+ retail places so that users can visualise the varying levels of activity at a small scale within a retail place, by hour. This has been incredibly useful for understanding movements of people throughout the course of the day and has for instance, helped food & beverage operators to identify key lunch and dinner hotspots, consequently informing their locational decisions.
We’ve also processed mobility data for a growing number of other countries, including Ireland, Japan, Malaysia, S. Korea and Thailand. The data has been particularly useful in markets where data availability is poorer as it has enabled us to understand shopping behaviour better and consequently build more accurate models.
Through processing this very large, powerful, timely data and packaging it up in MAPP in an easy-to-use, innovative format, we hope we have made it accessible and we look forward to the growing number of applications it can be used for in location-based decision making. We know we still have a long road to recovery, but we will continue to monitor the latest mobility patterns and will be interested to see how our high streets fare in the ‘new normal’ once we’ve come out of the other side.
Jasmin Fitzpatrick, Product Owner at Geolytix
Image: Photo by Laurenz Kleinheider on Unsplash
